

 Facebook
 Twitter
 Pinterest
 Copy Link
How Will the Presidential Election Impact Real Estate?
The year 2020 will be remembered as one of the most challenging times of our lives. A worldwide pandemic, a recession causing historic unemployment, and a level of social unrest perhaps never seen before have all changed the way we live. Only the real estate market seems to be unaffected, as a new forecast projects there may be more homes purchased this year than last year.
As we come to the end of this tumultuous year, we’re preparing for perhaps the most contentious presidential election of the century. Today, it’s important to look at the impact past presidential election years have had on the real estate market.
Is there a drop-off in home sales during a presidential election year?
BTIG, a research and analysis company, looked at new home sales from 1963 through 2019 in their report titled One House, Two House, Red House, Blue House. They noted that in non-presidential years, there is a -9.8% decrease in November compared to October. This is the normal seasonality of the market, with a slowdown in activity that’s usually seen in fall and winter.
However, it also revealed that in presidential election years, the typical drop increases to -15%. The report explains why:
“This may indicate that potential homebuyers may become more cautious in the face of national election uncertainty.”
Are those sales lost forever?
No. BTIG determined:
“This caution is temporary, and ultimately results in deferred sales, as the economy, jobs, interest rates and consumer confidence all have far more meaningful roles in the home purchase decision than a Presidential election result in the months that follow.”
In a separate study done by Meyers Research & Zonda, Ali Wolf, Chief Economist, agrees that those purchases are just delayed until after the election:
“History suggests that the slowdown is largely concentrated in the month of November. In fact, the year after a presidential election is the best of the four-year cycle. This suggests that demand for new housing is not lost because of election uncertainty, rather it gets pushed out to the following year.”
Will it matter who is elected?
To some degree, but not in the overall number of home sales. As mentioned above, consumer confidence plays a significant role in a family’s desire to buy a home. How may consumer confidence impact the housing market post-election? The BTIG report covered that as well:
“A change in administration might benefit trailing blue county housing dynamics. The re-election of President Trump could continue to propel red county outperformance.”
Again, overall sales should not be impacted in a significant way.
Bottom Line
If mortgage rates remain near all-time lows, the economy continues to recover, and unemployment continues to decrease, the real estate market should remain strong up to and past the election. Contact one of our Sales Agents today to discuss your real estate needs.
Local Real Estate Market Review – October 2017

 October’s Market Review Meeting was held a little more than a week before Thanksgiving, and a little more than a month before we ring in a new year. It’s the perfect time to talk about goals that have been set, goals that have and have not been met, and goals that have been exceeded. The Green Team’s Warwick office is one of the top ten agencies in Orange County, with a goal of being one of the top five! And the Vernon office, which opened its doors just 18 months ago, is already in the top 25 of all Sussex County agencies! The Warwick office, as of October 31 it has already exceeded 2016’s year-end total. Green Team New Jersey Realty does not have a full year to compare 2017’s sales to, but its anticipated year-end sales will clearly demonstrate a successful accomplishment for a new agency.
Exceeding Goals and Expectations
2017 has seen exciting goals being set and met by agents in both offices. Mention Sales Leader Awards in Warwick, and there are two names that immediately come to mind: Jennifer DiCostanzo, 2016 Sales Leader and First Quarter Sales Leader Award winner for 2017, and Nancy Sardo, winner of the 2nd and 3rd Quarter Sales Leader Awards for 2017. Jen has already exceeded her goal for this year, and Nancy is close to reaching hers. Who will be the 4th Quarter Leader and who will be 2017 Sales Leader? We can’t wait to find out! And, while these two battle it out, Chris Kimiecik, while new to real estate, has blasted way past his goal of $1,000,000 in sales. Other agents have either reached or exceeded their goals, and others are still working towards meeting theirs. In Vernon, Keren Gonen is a shining star! Another agent new to the business, Keren set a very high first year goal of $3,000,000 – and she has already exceeded that! These agents are excellent examples of the opportunities and possibilities that exist in our industry, as well as demonstrating the hard work, dedication and drive that it takes to reach and then exceed goals. There are many other agents who are exceeding the goals they set for themselves for 2017. Green Team’s agents in both offices are working hard, constantly striving to improve their knowledge and skills, all while providing top notch service to their clients. 2018 looks to be an exciting year for all.
“How is the market?”
When a client asks this question, an agent’s answer is indicative of their level of professionalism and knowledge. This market review meeting focused on how to analyze local real estate stats to provide a clear and accurate portrait of market conditions to clients.
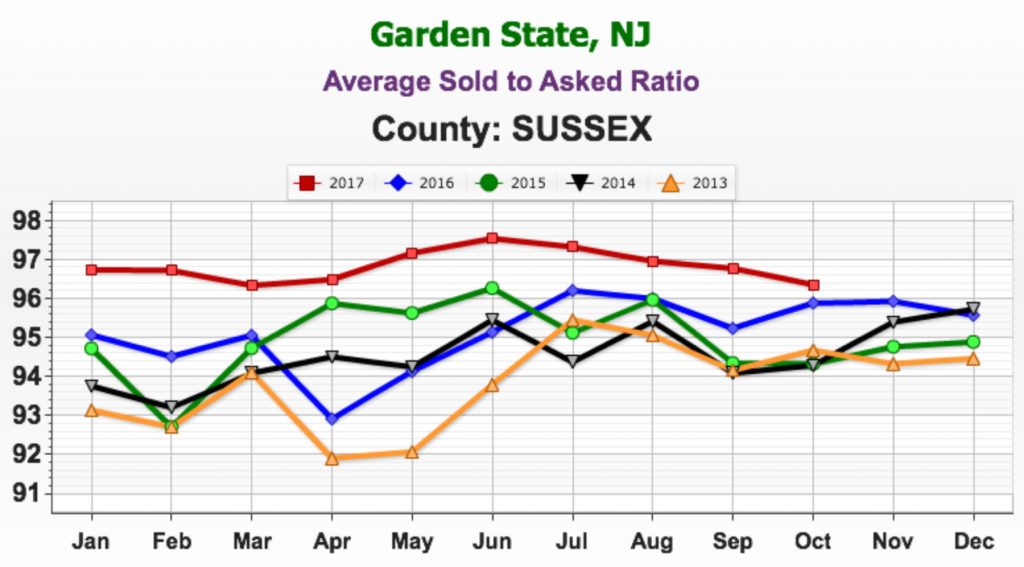
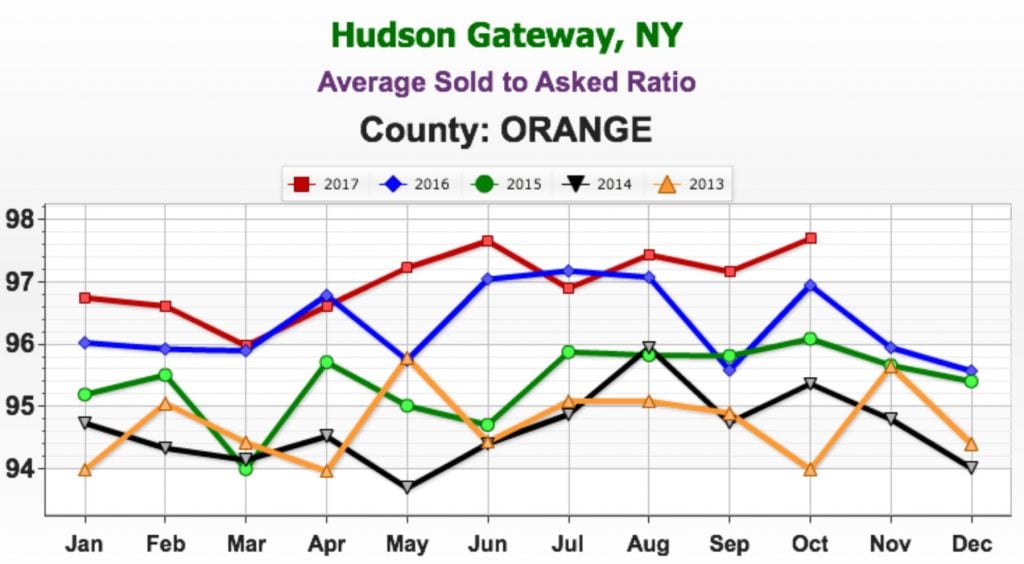
Average Sold to Asked Ratio
This is the percentage a house sold for under or over the last asking price (not the original price).
Sussex County:
With an average of 96.8%, the Sold to Asked Ratio in Sussex County in 2017 has been higher than any of the previous four years. There has been a slight downward trend since July, but this can be attributed to a seasonal fluctuation. Besides, October’s average of 96.35% is still higher than any month during 2013 to 2016.
Orange County: In Orange County, the Sold to Asked Ratio is almost 98%, which means the market is Hot!!!
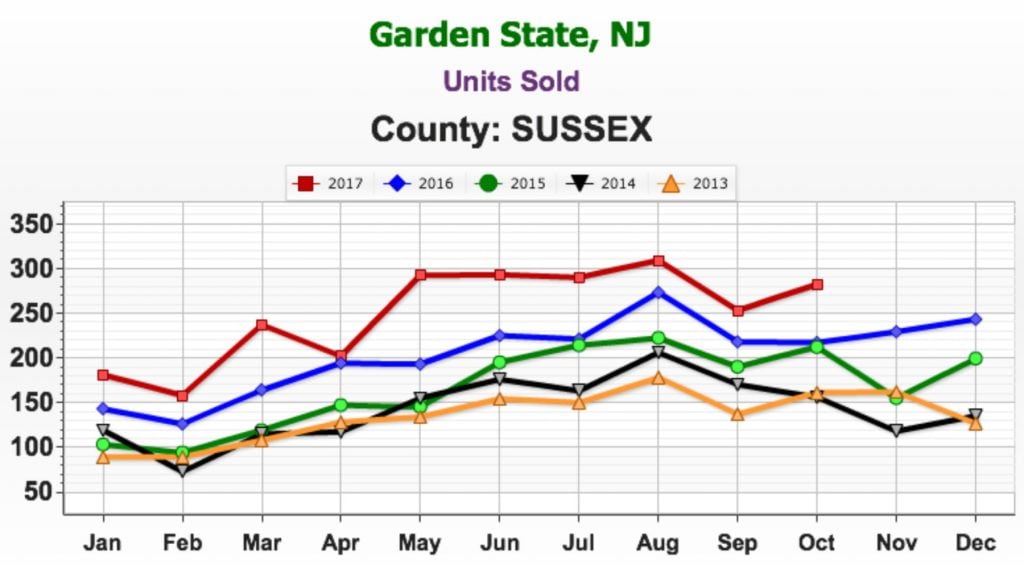
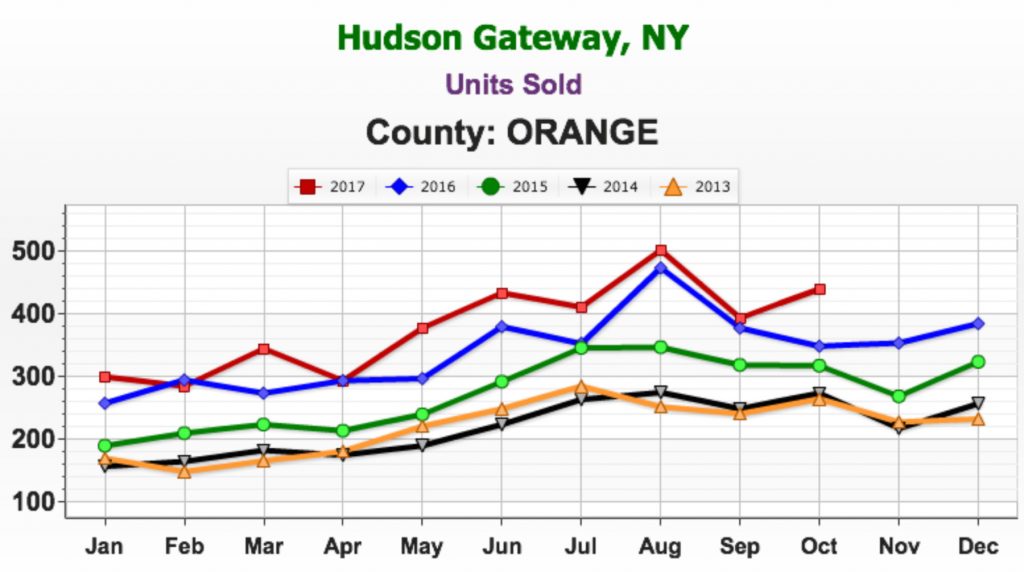
Units Sold
The term units here includes single family homes, condominiums, townhomes and multi-family homes with 1-4 units.
Sussex County: Here again, the stats show that the 2017 market is hot, with more units being sold this year than in any of the years from 2013 to 2016. There was a dip in September, but then a rise in October.
Orange County: Orange County seems to be trending the same as Sussex County, with a dip in September, then climbing back up in October. Green Team’s internal numbers track the market trend of the rise in the number of units sold in October. The number sold was greater than in July, which is unusual, and it was greater than October in each of the four years prior.
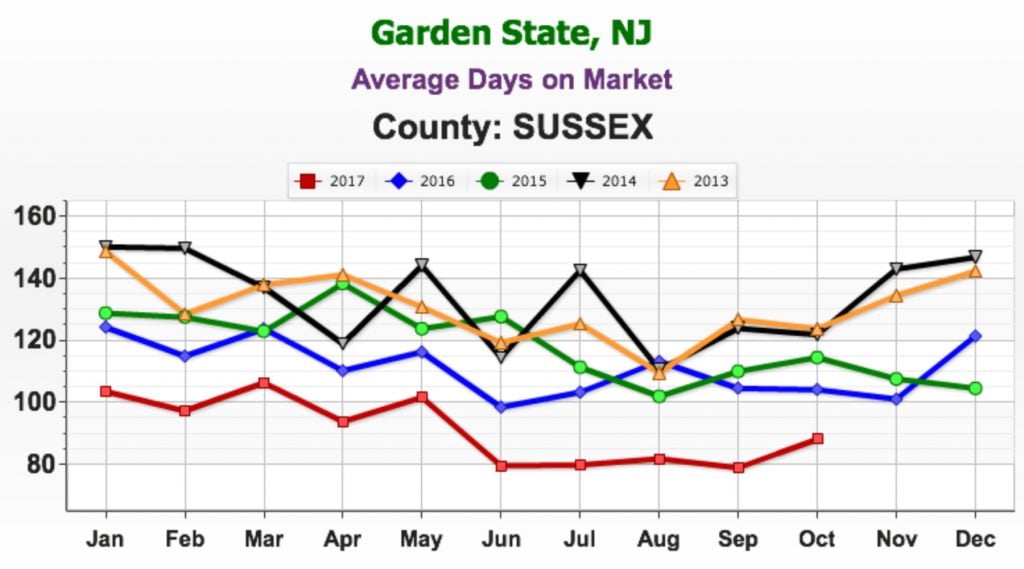
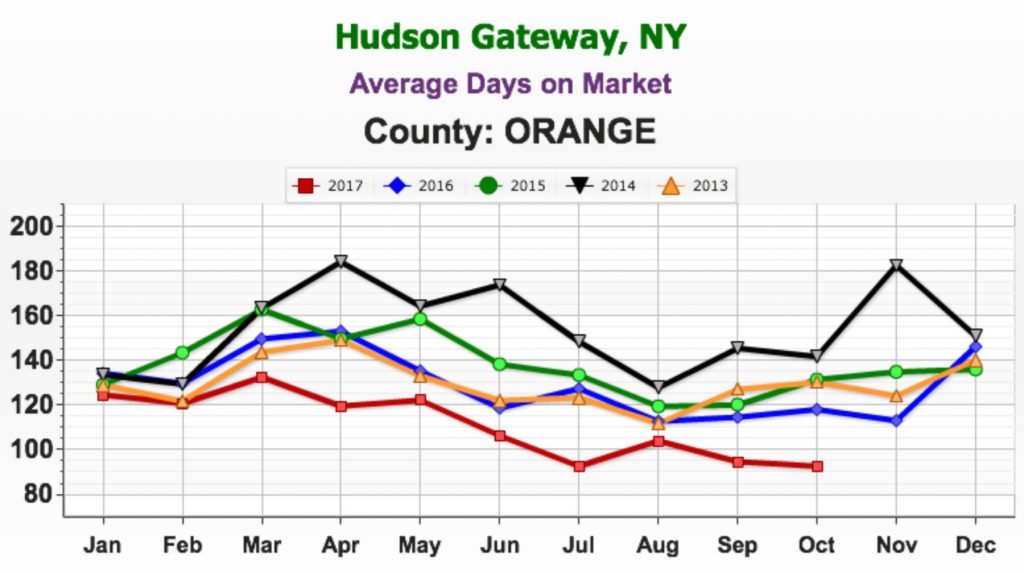
Average Days on Market
The faster things are selling, the hotter the market, so look for the lowest number on the graph as opposed to the highest. In New York State, the calculation was changed so that it is from the List Date to the Contract Date, rather than to the Binder Date, which was the standard 3 years ago.
Sussex County: With an average of 91.03 days on the market, 2017 once again proves itself to be a hotter market than the previous four years.
Orange County: A trend similar to Sussex. With an average of 110 days for the year to date, October listings are below that, with an average of 92.54. 2017 has been consistently lower than the prior four years.
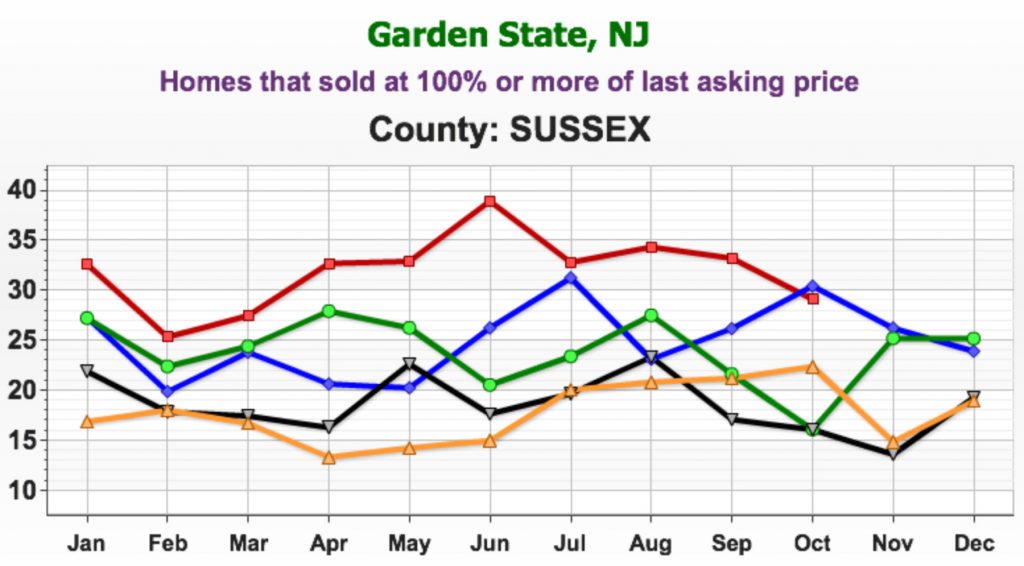
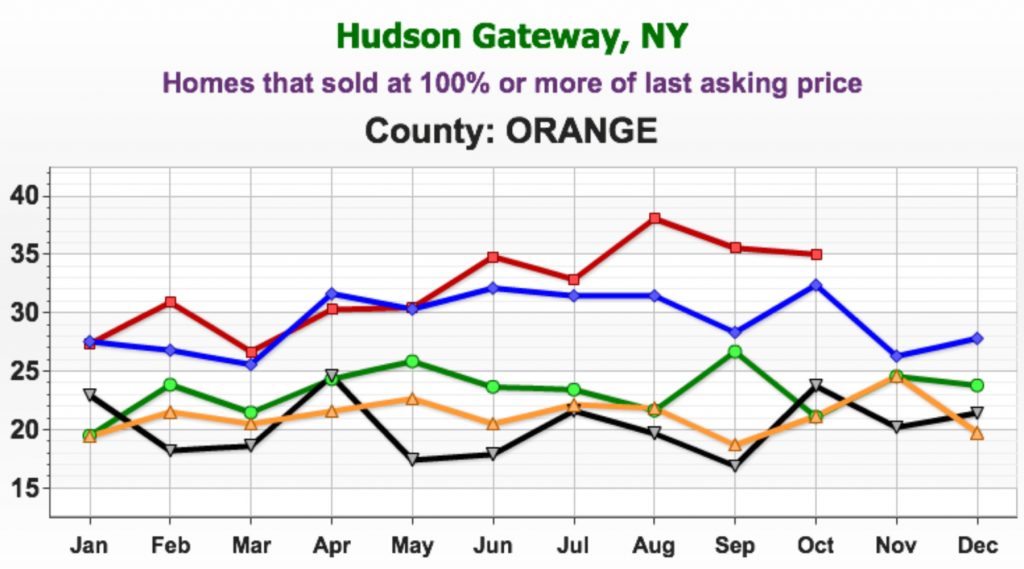
Homes that sold at 100% or more of last asking price
Sussex County: In October the number dipped slightly below last year’s October number, but still almost one-third of homes are selling at 100% of their asking price – or above it!
Orange County: Orange County is at approximately 35%, and is higher than last year.
Average Price
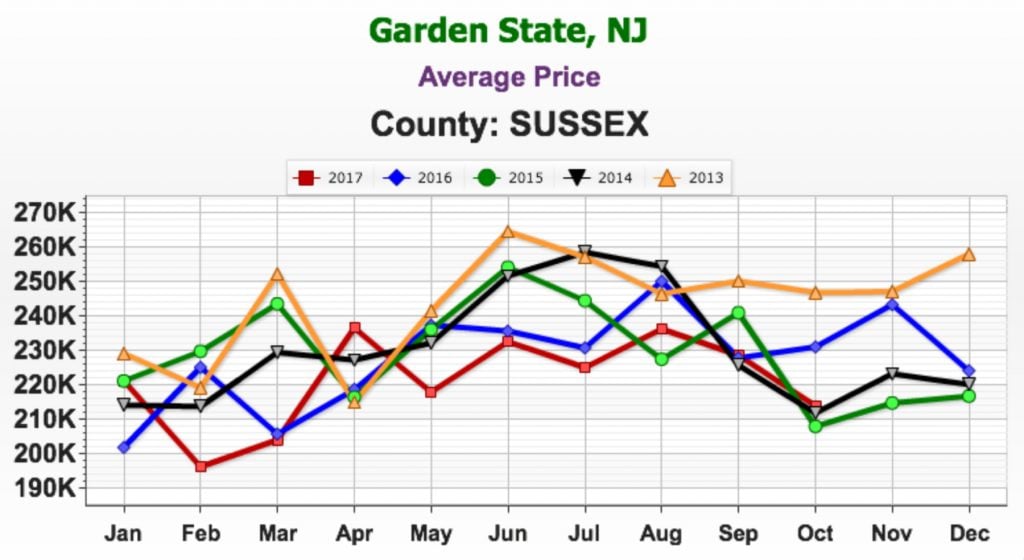
Sussex County: Despite the market being hot, prices have gone down since 2013, when the average price was $243,909. In 2017, it’s $221,196. In fact, on average, prices are lower this year than the last four years. When pricing a home for a client It is essential to look at hyper-local comparables.
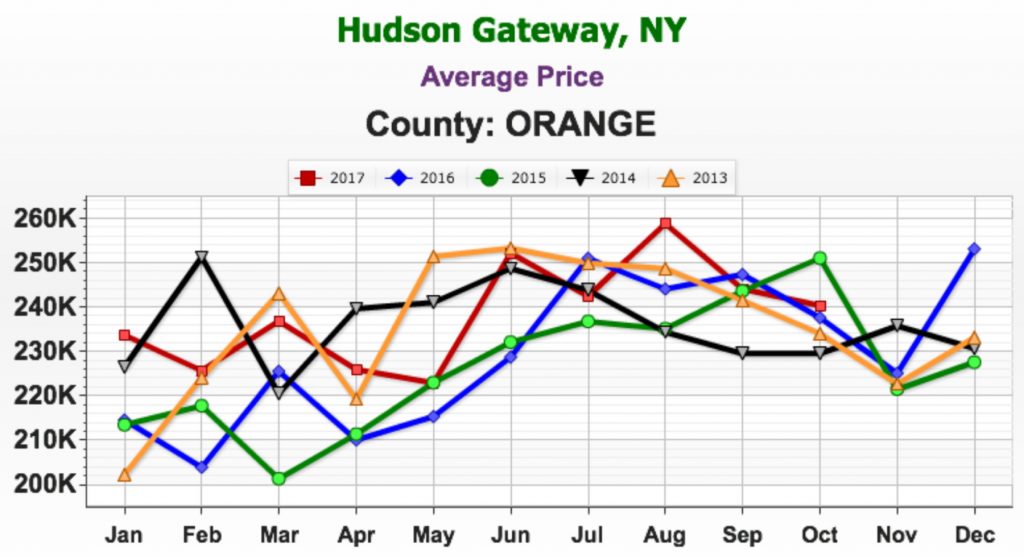
Orange County: The story is different in Orange County. The graph shows peaks and valleys, with some stabilization between September and October, and the average price of homes in 2017 is $238,220. That number was $235,213 in 2013, $235,868 in 2014, and $229,637 last year. Again, although the market is hot, prices have not risen as many might expect, so it is important to check local stats to see what houses in a given neighborhood are going for when pricing a home for the market. This does not appear to be a market trend where you can say prices are definitely coming up.
So, How is the Market?
After reviewing all of the data contained in the graphs for these categories for Sussex County and Orange County, the real estate market is Hot!!! If trends continue their upward climb we can anticipate another great year in 2018. Continue setting goals and let the market help you achieve the best possible deals for sellers, and find the best home, at the best price, for buyers.
Our Next Market Review Meeting
Our November Market Review Meeting is scheduled for Tuesday, December 12. As always, we look forward to keeping on top of our goals and discussing matters that are important to the success of your real estate transaction with our agents. We’ll then be posting information that we hope you’ll find interesting and helpful.
Do You Know the Cost of Waiting? [INFOGRAPHIC]

Some Highlights:
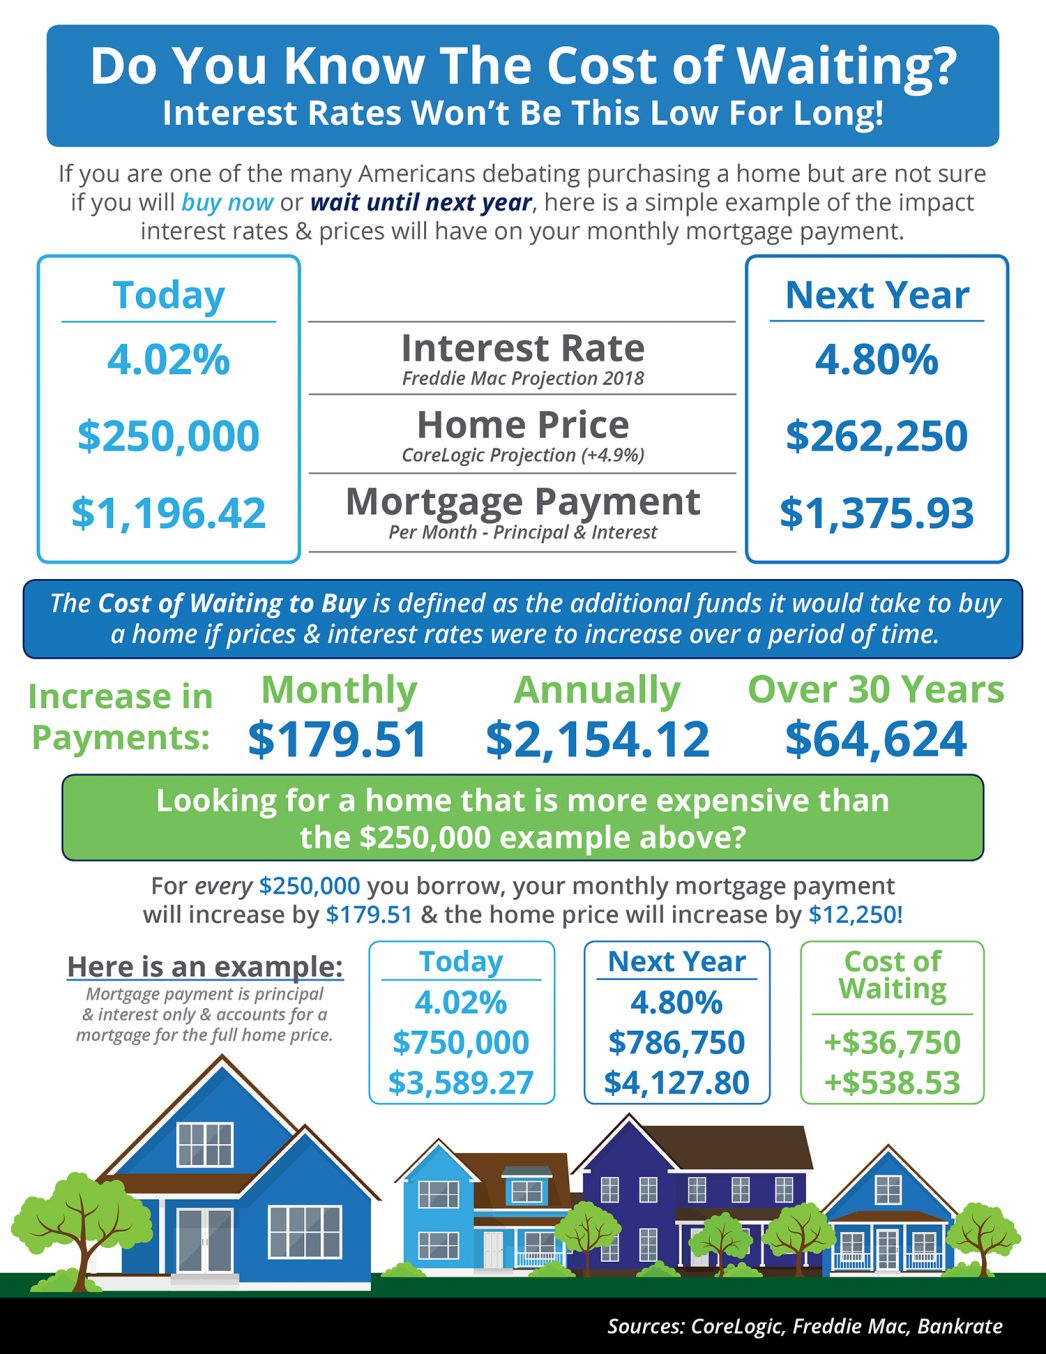
- The “Cost of Waiting to Buy” is defined as the additional funds it would take to buy a home if prices and interest rates were to increase over a period of time.
- Freddie Mac predicts that interest rates will increase to 4.8% by this time next year, while home prices are predicted to appreciate by 4.9% according to CoreLogic.
- Waiting until next year to buy could cost you thousands of dollars a year for the life of your mortgage!


